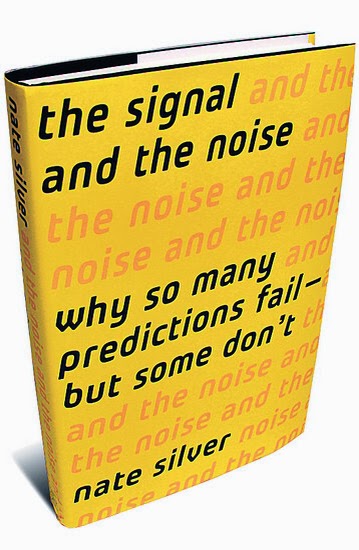
The book by Nate Silver “The Signal and the Noise …” is an amazing read. Very well written, entertaining as well as deep, it holds lessons and learnings that are applicable in our daily personal and professional lives. Its stated purpose is to look at how predictions are made, their accuracy, in several fields : weather, stock market, earthquakes, terrorism, global warming … But beyond that simple premise, it is a real eye opener when it comes to describing some of the deeply flawed ways in which we humans analyze the data we have at hand, and take decisions.
Nate Silver has very skeptical towards the promises of Big Data, and believes that the exponential growth in available data in recent years only makes it tougher to separate the grain from the chaff, the signal from the noise. One of the way he believes we should strive to make better forecasts, is to constantly recalibrate our forecasts based on new evidence, and actively test our models to improve our predictions and therefore our decisions. The key to doing that is Bayesian statistics … This is a very compelling, if complex, use of the Bayes Theorem, and it’s detailed through a few examples in the book.
As he explains, in the field of economics, the US govt publishes some 45,000 statistics. There are billions of possible hypotheses and theories to investigate, but at the same time “there isn’t any more truth in the world than there was before the internet or the printing press”, so “most of the data is just noise, just as the universe is filled with empty space”.
The Bayes Theorem goes as follows :
P(T|E) = P(E|T)xP(T) / ( P(E|T)xP(T) + P(E|~T)xP(~T) )
Where T is the theory being tested, E the evidence available. P(E|T) means “probability of E being true if we assume that T is true”, and notation ~T stands for “NOT T”, so P(E|~T) means “probability of E being true if we assume that T is NOT true”.
A classical application of the theorem is the following problem : for a woman in her forties, what is the chance of her having a breast cancer if she had a mammogram indicating a tumor ? The basic statistics are the following, with their mathematical representation if T is the theory “has a cancer” and E the evidence “has had a mammogram that indicates a tumor” :
– if a woman in her forties has a cancer, the mammogram will detect it in 75% of cases – P(E|T) = 75%
– if a woman in her forties does NOT have a cancer, the mammogram will still erroneously detect a cancer in 10% of cases – P(E|~T) = 10%
– the probability for a woman in her forties to have a cancer is 1.4% – P(T) = 1.4%
With that data, if a woman in her forties has a mammogram that detects a cancer, the chance of her actually having a cancer is of …. less than 10% !!! That seems totally unrealistic – isn’t there an error rate of only 25% or 10% depending how you read the above data ? The twist is that there are many more women without a cancer (98,6%) than women having a cancer at that age (1.4%), so the number of erroneous cancer detections, even if they represent only 10% of the cases where women are healthy, will be very high.
That’s what the Bayes theorem computes – the probability of a women having a cancer if her mammogram has detected a tumor is :
P(T|E) = 75%x1.4% / ( 75%x1.4% + 10%x98.4% ) = 9.6 %
Nate Silver uses that same theorem in another field – we have many more scientific theories being published and tested every day around the world than ever before. How many of these as actually statistically valid ?
Let’s use the Bayes theorem : if E is the experimental demonstration of a theory, and T the fact that the theory is actually valid, and with the following statistics :
– a correct theory is demonstrated in 80% of cases – P(E|T) = 80%
– an incorrect theory will be disproved in 80% of cases – P(E|~T) = 20%
– proportion of correct to incorrect theories – P(T) = 10%
In that case, the probability of a positive experiment meaning a theory is correct is only of 30% – again a result that goes against our intuition, as it seems from the above statistics that the “accuracy” of proving or disproving theories is 80% !!! The Bayes Theorem does the calculation right, and takes into account the low probability of a new theory being valid in the first place :
P(T|E) = 80%x10% / ( 80%x10% + 20%x90% ) = 30 %
There again, events with rare occurrences (valid theories) tend to generate lots of false positives. And this results in real life in a counter-intuitive fact : at the same time as there is a huge proliferation of published scientific research, it has been found that two-thirds of “demonstrated” results cannot be reproduced !!!
So … this book should be IMO taught in school … It gives very powerful and non-intuitive mental tools to make us better citizens, professionals and individuals. I don’t have much hope of this making its way into the school curriculum any time soon, so don’t hesitate, read this book, and recommend it to your friend and family 🙂